Share
SEO & The Indexation Sawtooth
When you start to get serious about SEO, one of the metrics to track is the number of webpages and images that Google is indexing on your site. Whi...

When you start to get serious about SEO, one of the metrics to track is the number of webpages and images that Google is indexing on your site. While indexation isn’t directly correlated to SEO, it’s a pretty good indication of whether your content is meeting algorithmic thresholds to be included in search results. In other words, the more content you have indexed, the more likely you are to appear in search results – even if they might be really niche.
And truth be told, when Google tweaks algorithms, we don’t just see search traffic fluxuate, we also see indexed content move around too. How do you know what’s indexed? Go to Google and type “site:[yourdomain]”.
The results show you the number of pages included in the index. You can also do the same on Google Images.
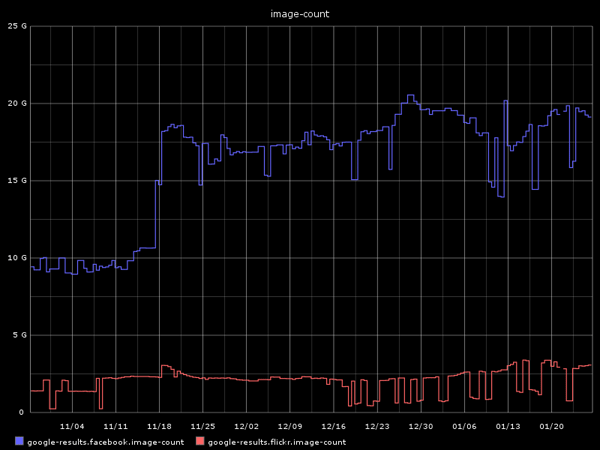
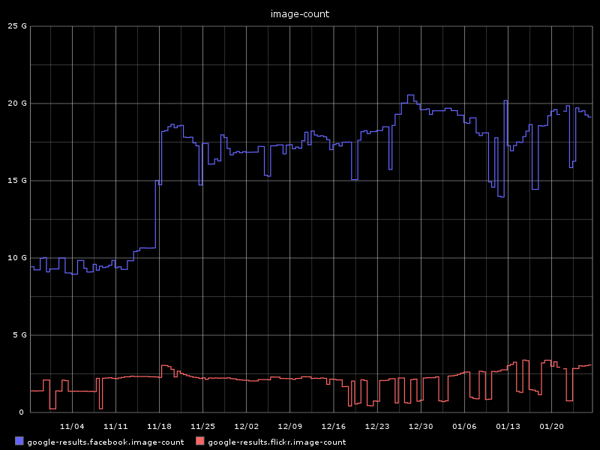
When Panda hit last year, we started to track indexed content on a more regular basis. Then we decided to collect the data on the total indexed content over a trailing 90-day basis, and graph the results. Here’s a graph of Facebook and Flickr images:
Quite honestly, we were a little shocked. The day-to-day fluctuations ( or “sawtooth” formation) were disturbing. There were some days where we witnessed a 90% drop in (reported) indexation. But in doing some light testing, it didn’t seem like the results on the top SERP (search engine result page) for any given keyword term were falling out, so we assumed that the content in question was poorly ranked content. Not long tail content, mind you, but stuff that might be on page 73 of Google search results, and whose presence (or lack thereof) would have little impact on the majority of searches.
The theory behind the daily sawtooth is that we’re hitting different banks of servers at various times, and it’s a thought that we shared with Will Critchlow from Distilled, one of the top SEO firms. He agreed that this was probably the case.
The more disturbing trend was these massive upswings. If you’re Facebook (in blue), you’re thrilled. Your total number of indexed images went from 10 billion images to 17 billion overnight and stayed there for the most part. If you’re Flickr, you’re pretty pissed off (and I’m not talking about your feelings toward Yahoo!). Flickr is a great site with awesome images used by millions of people. So what is Facebook doing that Flickr is not? It might be a sitemap. It might be that a lot of pages of images were in robots.txt for exclusion. It might be the addition of some other structuring of data that made indexing more effective. It might be an algorithmic change.
Takeaway
Whatever the case may be, the indexation graph provides us an interesting look at the unpredictability of SEO, and can illustrate that signal and algorithmic changes can dramatically affect results. Fortunately for PhotoShelter members, our internal results have yielded very favorable results with overall image indexation up 400% in the past few months. This doesn’t necessarily mean that every member was positively impacted by our regular SEO updates, but rest assured that we are monitoring these types of trends closely and continue to test various improvements.
Want more strategies and insights to improve your website’s search engine rankings? Sign up and get the free 39-page SEO for Photographers Workbook, plus more tips sent right to your inbox with our 4-week Bootcamp.


